What about the atmosphere?
EARL is able to see up to 30,000 meters, but usually anything higher than about 14,000 meters is too noisy to distinguish. Therefore, EARL generally shows us distinct information about the troposphere and little information about the stratosphere.
The troposphere is the layer of the Earth's atmosphere closest to the Earth's surface. It stretches from ground level to about 8-17 kilometers. Most of the weather, including clouds, rain, humidity, haze, etc, occur within the troposphere. The boundary layer is the bottom section of the troposphere. The height that the troposphere stretches to varies depending on season, time of day, weather, and latitude. Directly above the troposphere is the stratosphere. Where one ends and the other begins is a distinct region called the "tropopause." The height of the tropopause indicates the depth of the troposphere. Now, temperature is well known to decrease with height. Imagine all those mountains that are tropical at the bottom and yet have snow and ice on the tips of them--this is because temperature decreases as altitude increases. But this only occurs in the troposphere and the mesosphere. In the stratosphere, temperature increases with height. Have you ever heard about how there is ozone in the atmosphere? Most of that is at 25 kilometers, in the upper part of the stratosphere. Sunlight streams down and bounces off ozone, heating up that portion of the stratosphere.
The troposphere is the layer of the Earth's atmosphere closest to the Earth's surface. It stretches from ground level to about 8-17 kilometers. Most of the weather, including clouds, rain, humidity, haze, etc, occur within the troposphere. The boundary layer is the bottom section of the troposphere. The height that the troposphere stretches to varies depending on season, time of day, weather, and latitude. Directly above the troposphere is the stratosphere. Where one ends and the other begins is a distinct region called the "tropopause." The height of the tropopause indicates the depth of the troposphere. Now, temperature is well known to decrease with height. Imagine all those mountains that are tropical at the bottom and yet have snow and ice on the tips of them--this is because temperature decreases as altitude increases. But this only occurs in the troposphere and the mesosphere. In the stratosphere, temperature increases with height. Have you ever heard about how there is ozone in the atmosphere? Most of that is at 25 kilometers, in the upper part of the stratosphere. Sunlight streams down and bounces off ozone, heating up that portion of the stratosphere.
Have you heard of the tropopause?
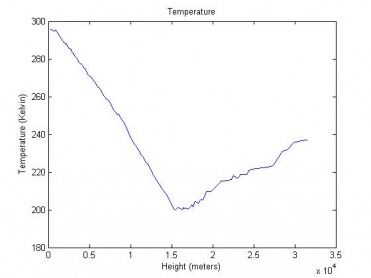
This is a graph of temperature as altitude increases. Where it dips, the point near the center, is the tropopause. Because temperature decreases in the troposphere and increases in the troposphere, the point where the temperature switches from decreasing with altitude to increasing with altitude is the tropopause. For this particular day, the tropopause is located at 15 kilometers. Generally, the tropopause is around 15 kilometers for our location in Decatur, GA, during a clear day in the summertime.
We use several types of weather data to keep an eye on the weather, in addition to using LIDAR. Much of our time is spent on weather.com watching storm clouds to make sure that they are not heading toward Decatur. The EARL assembly works best if it is not rained upon, and water can destroy several pieces of the equipment. We also use radiosonde data so that we compare what we observe of, say, temperature with what a satellite nearby records the temperature as being at varying levels of height. The graph above was created using radiosonde data from the FFC station nearby.
We use several types of weather data to keep an eye on the weather, in addition to using LIDAR. Much of our time is spent on weather.com watching storm clouds to make sure that they are not heading toward Decatur. The EARL assembly works best if it is not rained upon, and water can destroy several pieces of the equipment. We also use radiosonde data so that we compare what we observe of, say, temperature with what a satellite nearby records the temperature as being at varying levels of height. The graph above was created using radiosonde data from the FFC station nearby.
The Stratospheric Aerosol Layer
The Stratospheric Aerosol Layer is a layer of the atmosphere inside of the stratosphere, discovered by Christian Junge, which contains particles that are predominantly made of sulfur and have a radius between .1 and 2 microns. Most of these particles are water-soluble [1]. The SAL affects solar radiation and ozone, and monitoring its constitution and flux is important for measurements and observations of climate change, volcanic particles, and aerosol pollutants. Most of the aerosols in this layer are due to the SO2 released from volcanic explosions, although some are natural biological products that rise from the troposphere and other aerosols are human-made [2]. The SAL generally ranges from fifteen to eighteen kilometers, just outside the normal range for which EARL is optimized. The EARL has initially only been optimized with the PMT voltage for altitudes of up to fourteen kilometers. However, in October 2011 we optimized the EARL for the SAL so that we could do layer-specific observations with the lidar.
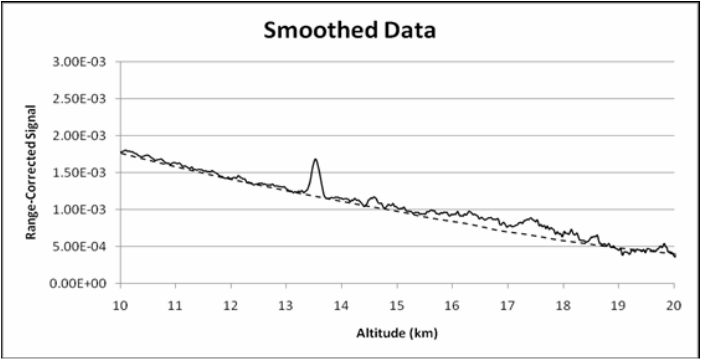
The figure above shows how much signal, which is relatively correlatable with the density of particles in the atmosphere above the EARL, that the EARL receives as a function of altitude. This signal has been corrected for the range fall-off of intensity. Altitude is on the x-axis, and the received signal/particle density is on the y-axis. The dashed line is the atmospheric density that we get from sounding data. This graph shows us that the EARL is capable of measuring up to twenty kilometers. The bumps in the signal above the dashed line indicate that we received signal back that is not due to the normal density of the atmosphere. From the figure above, we can determine that there is some amount of observable aerosols in the Stratospheric Aerosol Layer. According to current research, the SAL does not currently have much SO2. Therefore, the current SAL is perfect for creating a baseline of background, non-volcanic aerosols. If we create a baseline of the normal amount of aerosols in the SAL, then we can work from the baseline to determine how much of the SAL is due to SO2 once another volcanic eruption occurs. Haviland Forrister (Agnes Scott) is currently conducting research with Gary Gimmestad (Georgia Tech Research Institute) for this purpose.
[1] Junge, Christian. "A World-wide Stratospheric Aerosol Layer." Science. 133.3463 1478-1479. Web. 19 Sep. 2011.
[2] Thomason, Larry. United States. Introduction on Stratospheric Aerosol. Hampton, VA: , 2001. Web. <http://aerosols.larc.nasa.gov/indexintro.html>.
