Future Research Interests
There are several opportunities for any graduate, undergraduate or high school students interested in the EARL for atmospheric determinations. These can mostly be divided up into computational/experimental projects and less computational/observational projects.
Experimental Projects
Every lidar apparatus has its own, distinct "lidar equation" that includes the noise components of that specific system, the reaction of backscattered aerosols to that lidar's specific wavelength, and so on. One opportunity for working with the lidar is to try and solve this equation by finding the values of all of its components. This would increase EARL's ability to calculate density data of the atmosphere, clouds, aerosols, etc. in the atmosphere above the Observatory. As it is, all of EARL's data can only be understood relatively. We see a thick layer and can determine that something is up there. However, even when we look outside or take a picture with the Bradley Skycam and verify that a cloud is the main object visible at that altitude, we do not know the density, temperature, pressure, etc. inside of the cloud. Solving the lidar equation for EARL would help us immensely in our goal of being able to calculate these.
Another experimental project relates to the calculation of what percentage of light the cloud cover blocks. For especially sunny (or overly cloudy) days, EARL can tend to get saturated by all of the light it is receiving back. Therefore, two previous students created a cloud cover that they predicted would cut out a certain percentage of light. One experimental project would be determining the actual percentage of light that the cloud cover cuts out and finding a way to input in the Matlab script (or the new EARL GUI) how to correct for this change in cloud cover. Possibly, the change would have to be done prior to entering the data into the GUI by calculation in Excel or some similar program.
Another experimental project relates to the calculation of what percentage of light the cloud cover blocks. For especially sunny (or overly cloudy) days, EARL can tend to get saturated by all of the light it is receiving back. Therefore, two previous students created a cloud cover that they predicted would cut out a certain percentage of light. One experimental project would be determining the actual percentage of light that the cloud cover cuts out and finding a way to input in the Matlab script (or the new EARL GUI) how to correct for this change in cloud cover. Possibly, the change would have to be done prior to entering the data into the GUI by calculation in Excel or some similar program.
Observational Projects
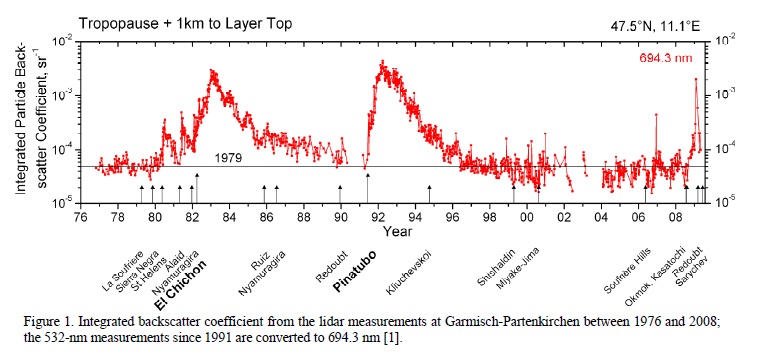
The predominant observational project with perhaps the highest level of importance to professors and advisers who work with the EARL is monitoring the Stratospheric Aerosol Layer (SAL). Research is currently being done to create a baseline and background of data for future student to monitor the change and flux of the layer in comparison to. The picture below is from a paper by T.Trickl, H. Giehl, H. Jager, and M. Fromm called “33 years of stratospheric aerosol measurements at Garmisch-Partenkirchen." In it, the Garmisch-Partenkirchen lidar has observed fluctuations in the SAL from 1976 to 2008. We wish to do this same observation and focus with EARL. Gary Gimmestad of the Georgia Tech Research Institute is willing to help and advise students who are interested in monitoring this layer. (See Current Research for more information.)
Another interesting Observational Projects is in the characterization of depolarized particles in the stratosphere. In order to view depolarization (and therefore see what particles in the atmosphere are "spiky" and thus made of pollen, non-spherical aerosols, ice, etc), we need for EARL's Pockels Cell to be working. Sadly, the part is currently broken and means are being taken to obtain a new one. However, we do not yet know when we will have a new Pockels Cell to observe depolarization effects, so all the days we took data from late July 2010 until the present have no depolarization data.
Most season-dependent, observation-dependent projects where we see something interesting in the data can usually apply themselves to an observational project. For example, certain sets of data from June and July 2010 contain humidity fluctuations that are obvious in the data. Taking several data sets on especially humid days, possibly humid and windy days, would create some interesting data and be the start of an interesting project. Taking data sets on days where warm or cold fronts are coming into Atlanta are also interesting since we can observe the whole process of a warm/cold front coming toward us. Taking data sets on days where most people have allergies is also a fun project. One student has previously observed pollen on a day in the spring.
The imagination is the limit, here.
