June 10, 2010
Lauren had strep throat today, so Haviland started up EARL without her. She ran EARL from 1:48pm GMT until 7:46pm GMT, when it started to rain. It had not let up by 10:00pm GMT, so she shut down the computer and left. Most of the day was cloudy, and as such caused a lot of saturation on both short and long range channels. Haviland put the cloud cover on because the saturation was too high at 1:48pm GMT. By 1:55pm GMT, there was still too much noise in the data and the channels were still too saturated despite the cover, so Haviland stopped saving data. At 2:19pm GMT, data-saving was turned back on; short range channel still had a lot of noise. At 2:43 the Saving was turned off to fix voltage. The short range voltage was changed from 633V to 619V, with 8 data sets per save. This reduced noise as much as possible and made it so the red Cross-Polar line was no longer above the white Co-Polar line. Haviland stopped saving from 2:55pm GMT until 2:57pm GMT and took of the cloud cover. She did not put it back on until 4:42pm GMT, when both channels were saturated.
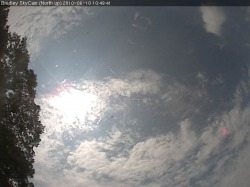 The Range Corrected Backscatter plot below show some slight noise that is likely lower clouds at about 1 km at 5:20pm GMT. However, there is also something up at 5 km. In the first picture to the right, there are larger, dark fluffy grey clouds near the outer edges and thinner, tinier, lighter grey clouds near the center of the image. I believe these tiny clouds are not tiny, but merely far away, and that they are the depolarized backscatter signal coming from 5 km.
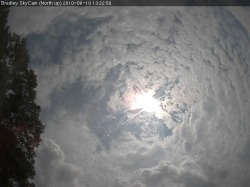
In the second picture to the right, these tiny clouds are still far up, but there are thicker, darker, larger clouds near the bottom. These can be seen from 1-2 km at 7:10pm GMT, when this photo was taken, on the Range Corrected Backscatter graph. The little dots of noise extend higher than just 1 km, where they have been consistently since 4:30pm GMT as little white specks. This thickness of white specks suggests several layers of thick clouds, which eventually turned into rain at 7:46pm GMT. |
The "something" at 5 km initially started around 2:30pm GMT. The sky had thin, wispy clouds that easily saturated the short and longe range channels. The cloud cover was on the primary mirror to prevent this saturation. A signal still came through at 5 km. The clouds seem small in the picture, which could be due to their thinness or their altitude. Perhaps those clouds were just very, very high up. These thin, light clouds appeared later on at 5:20pm GMT, as can be seen below.
  |
Today was also the first day of Haviland's "I think we can predict the rain!" shebackle. At 7:46pm GMT, Haviland noticed a couple of raindrops on the mirror, so she immediately closed the hatch, covered the telescope, and deleted any EARL files that contained empty data. Prior to this, Haviland had been experimenting with viewing the real-time data, right after it had been compiled into its 42-data-sets-per save file, with the EARL Analyzer Excel spreadsheet. This allowed her to view the data she was getting without the noise that the screen showed.
On especially cloudy days where the short range voltage on the EARL Electronics Box has to be dialed down to 619 V rather than 637 V and where the red Cross-Polar line keeps jumping up above the white Co-Polar line and where everything looks noisy on the real-time graph... Haviland's suggestion is to (A) minimize the amounts of data sets per save to 8 or 16, depending on how bad the noise is and how often you want to be updated, and (B) to view the data in the EARL Analyzer Excel spreadsheet every few minutes, to know what you are looking at. The upside to this: she found that, right before it rains, there are 3-4 cloud layers near each other in altitude, and each is spikes high in contrast to the boundary layer. The downside: you might get so engrossed in the spreadsheet that you do not realize that a few rain droplets just got on the primary mirror.
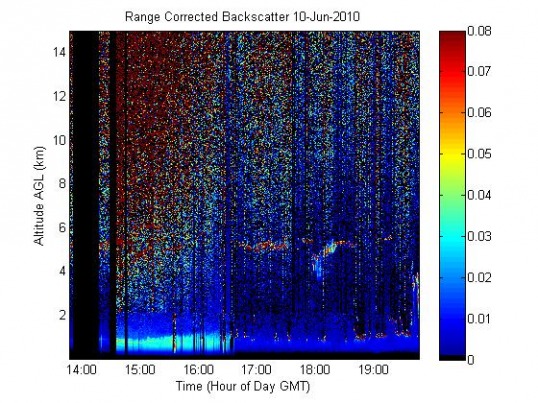
Look at those signals! The low clouds, most observable by the Skycam, do not show up on the graph of the earlier part of the day. But they appear as almost noise at about 1 km from 4:30pm GMT until 8:00pm GMT. Meanwhile, this weird signal that Haviland was keeping track of at 5 km actually showed up in the Range Corrected Backscatter plot. From about 4:30pm GMT until 6:30pm GMT, a strong signal exited at about 5 km. It could not be seen from the Bradley Skycam because it was above the lower clouds, but something was definitely up there. Even more, it had a depolarization signal, as can be seen from the graph below.
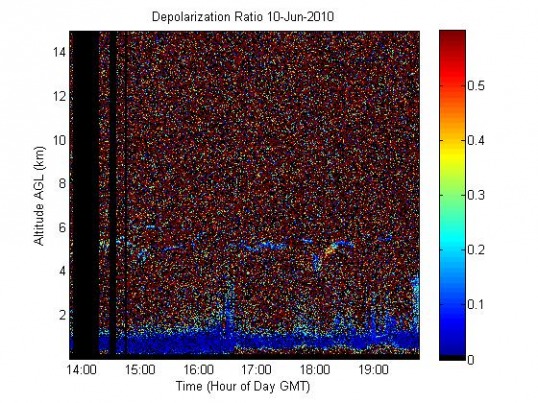
See? There they are again! The Depolarization Ratio graph shows that something with a strong depolarization signal exists at 5 km, and it was strongest at 6:00pm GMT. The shapes on the Depolarization Ratio graph correlate precisely with the 5 km shapes on the Range-Corrected Backscatter plot above it. Also, this tunnel of something significant shows up at the end of the data, both on the Range-Corrected Backscatter plot and on the Depolarization Ratio graph. Do you see it? Look on the far right, just along the right edge. A skyscraper-looking signal is at the end on both of the plots. However, the similar, slightly smaller-looking skyscraper at 4:30pm GMT on the Depolarization Ratio graph does not have a twin on the Range-Corrected Backscatter plot. Instead, that area is dark. What is the difference? The one at the end was directly before it rained, when the clouds were thicker and more close together, ranging from 1 to 3 km. Exciting! There is no obvious rain-prediction in the graph; however, there is an interesting correlation that should be kept an eye on in the future.
Questions: what was at 5 km? Contrails from airplanes are not that low, nor are cirrus clouds; and yet there is a very obvious depolarization signal that correlates with the range-corrected backscatter. There are very obvious depolarized signals from what look like cloud possibility at 5 km all day.
Questions: what was at 5 km? Contrails from airplanes are not that low, nor are cirrus clouds; and yet there is a very obvious depolarization signal that correlates with the range-corrected backscatter. There are very obvious depolarized signals from what look like cloud possibility at 5 km all day.
