June 21-22, 2010
This was our first 24-hour data run. Sadly, about 30 minutes of data were lost due to the computer having a Hardware Malfunction, but Haviland jiggled the memory in the computer, turned the UPS and computer off and on several times to get the computer to stop beeping, and was eventually able to get the system to start up again. Thankfully, none of the data taken before the Malfunction was lost, and the computer ran normally for the next few hours. Also, round about 11:30pm GMT, either the EARL Electronics Box or the computer was making an odd "crrrrr!" sound every ten minutes or so that was quite frightening and very worrisome. An eye should be kept out for any more repetition of this sort of noise, as well as an investigation into what it might be.
The data run began at 1:54am GMT, which correlates with 9:54pm EDT on June 21st. Most of the nighttime was clear with no clouds in sight. By 12:00pm GMT, no clouds had yet to appear. The actual day-part of the data run kept having clouds, however, from big and fluffy to high and thin. The Range Corrected Backscatter graph below shows clouds from as low as 1 kilometer to as high as 14 kilometers.
The data run began at 1:54am GMT, which correlates with 9:54pm EDT on June 21st. Most of the nighttime was clear with no clouds in sight. By 12:00pm GMT, no clouds had yet to appear. The actual day-part of the data run kept having clouds, however, from big and fluffy to high and thin. The Range Corrected Backscatter graph below shows clouds from as low as 1 kilometer to as high as 14 kilometers.
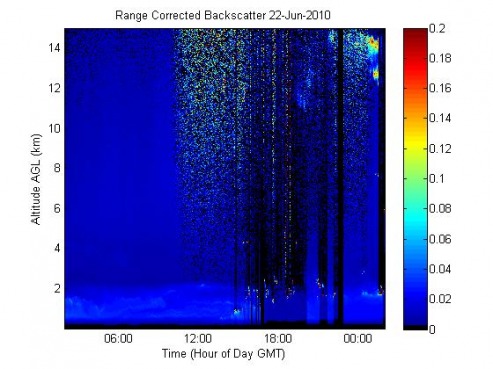
As would be expected, the lower 1-2 kilometer clouds do not show much depolarization on the Depolarization Ratio graph below. However, some amount of depolarization is there. For example, look at the low 1 kilometer cloud at about 3:00pm GMT on the Range Corrected Backscatter graph. It is the first significant cloud of the day. On the Depolarization Ratio graph below, it just shows up as a tiny clip at 3:00pm GMT, but it does show up. Also, like yesterday, the orange noise that takes up most of the graph seems to spike downward and culminate in where each cloud is shown to be on the Range Corrected Backscatter graph.
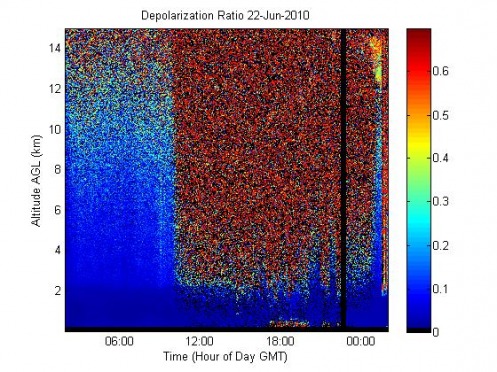
The most important thing of the whole night, sadly, could not be observed in full. At about 1:00am GMT (at the end of the data run), something showed up that stretched from 12 to 14 kilometers on both the Range Corrected Backscatter graph and on the Depolarization Ratio graph. Since most things up that high are clouds or contrails that have ice molecules in them, the depolarization is not a surprise. What is a surprise is how thick this object is. It is almost a whole 2 kilometers thick! What type of cloud, especially a cirrus cloud, is 2 kilometers thick? A picture was taken at about 1:30am GMT that might correlate with the signal at 12-14 kilometers.
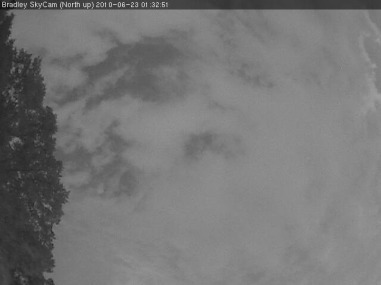
That dark gray cloud in the upper right of the picture is not a cloud at all. That is the sky. The whole rest of the picture, all the light gray, is the actual cloud. Perhaps this explains why it is so thick on the graphs--in the sky, you can't even see past the cloud! However, the cloud does not look to be up at 12 kilometers; it looks much closer than that. At about 2 kilometers at the same time, there was a cloud that seemed relatively normal and lasted for a while. It is likely that the light gray cloud in this picture is actually the 2 kilometer cloud. So what is up at 12-14 kilometers? It might be a cirrus cloud, but it did not last more than an hour. There also seem to have been two cirrus clouds. One was at a higher altitude and mostly went away before a slightly lower one came in and lasted for even shorter amount of time.
