July 19, 2010
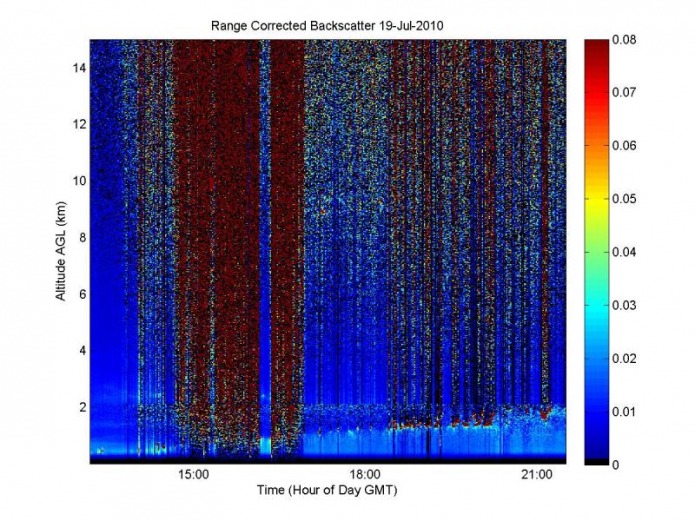
Today's run started at 1:11pm GMT. There were a few clouds in the sky although it was mostly clear out. The boundary layer looked potentially interesting, but that did not show up on the final graphs. The sky was filled with plane contrails, but none of them seem to have gone directly above the EARL hatch and, therefore, did not show up on the Range Corrected Backscatter graph. Haviland wanted to keep an eye on how the MICROTOPS/Sun Photometer data changes over the course of the day, so she took METAR and Photometer data at hour intervals.
No Depolarization Determination: The Broken Pockels Cell Strikes for the First Time
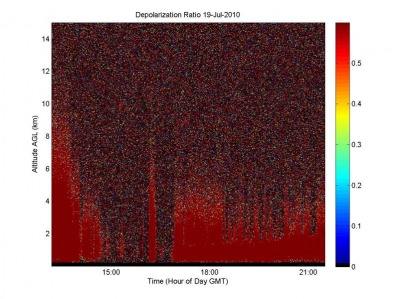
Ever since last Friday, the Pockels cell has not been working. Therefore, the laser is only being sent out in one direction, so we cannot observe depolarized returns. On the real-time RunEarl.vi screen, the red line (usually the Cross-Polar returns) is exactly even with the white line (the Co-Polar returns). The white line indicates the total amount of backscattered light, and the red line indicates the amount of backscattered light that is bouncing off of "spiky" objects, like ice, pollen, dust, and other aerosols. The current Depolarization Ratio graph serves as a graph of what ranges we are getting a deducable signal from. Somehow, the graph still looks a bit normal. Usually, the red areas would be blue; but if there is not a cloud in sight, then the Depolarization Ratio graph usually stretches up about half of the range with a blue stalagmite-shaped figure. When there are clouds, the Depolarization Ratio graph stretches up to the clouds and stretches up on either side of the clouds. This can be observed on today's graph from about 6:00pm GMT until about 9:00pm GMT.
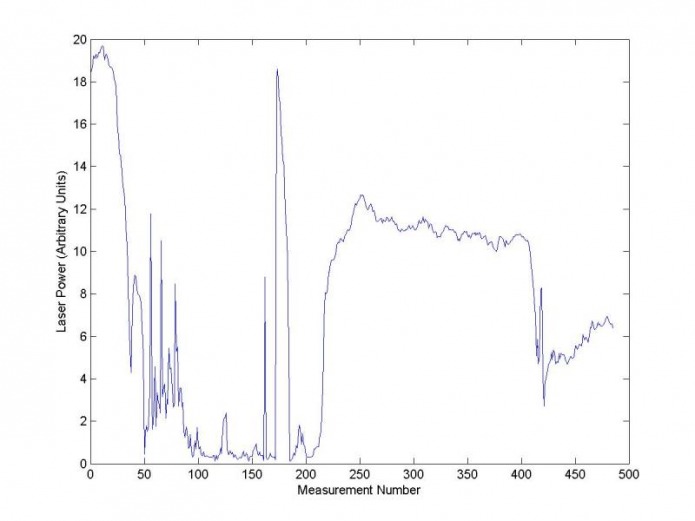
By 6:32pm GMT, the laser power was down to 11.2 milliwatts. By 6:33pm GMT, it was down to 10 milliwatts and seemed to stay there for a while. Since laser power is usually around 33-35 milliwatts, this was worrying. Today started off with a laser power of 19 milliwatts, and usually the laser power gradually increases from 15 milliwatts to about 30 milliwatts. Haviland assumed today would be the same, until she looked at the laser power five hours later. Apparently, the power was at odd levels all throughout the day. Mostly, it stayed between 10 and 12 milliwatts (1/3 of the usual power), and it also stayed between 4 and 6 milliwatts (1/6 of the normal power). Despite all this, the Range Corrected Backscatter graph seems to have turned out relatively normal.
Since the laser ran at relatively low power throughout the day, the Range Corrected Backscatter graph is especially fortuitous in exemplifying how much signal a low-power LIDAR can pick up from the sky.
Since the laser ran at relatively low power throughout the day, the Range Corrected Backscatter graph is especially fortuitous in exemplifying how much signal a low-power LIDAR can pick up from the sky.