July 6, 2010
We came in today not expecting to be able to do a data run. The computer started up with the same Memory Parity Error that it has been giving us for the past couple of weeks and that we thought we had fixed by getting a new hard drive. Apparently not. A lady from ITS came by, took out the memory, and the placed the memory back into the slots, and presto! Instant working computer.
By the time we started up the run, it was 3:28pm GMT. The ITS lady wanted to make it so the SARA computer (which is a couple feet away from the EARL computer) shared a network drive with the EARL computer, for easy information transfer. Therefore, we stopped the data run from 3:37pm GMT until 4:03pm GMT, and then we started it back up and observed until 8:12pm GMT. In the meantime, we created an adjustable cloud mask that would allow us to block from 50-100% of the light that enters the mirror. This way, we do not have to keep switching between the bowtie cloud mask and the pendant cloud mask. The new mask looks like a cross between one of those white stand-up fans and a nuclear reactor warning.
When we turned the LIDAR back on at 4:03pm GMT, both channels were saturating and had returns near 30,000. This usually indicates that the channels are truly saturating rather than just fake saturating, so we put the new cloud mask on, set to 50%. However, considering how the data turned out, I think we should institute a "No Cloud Mask" policy unless the data is being negatively effected. So far, the only bad saturation problems we have found with the data are: A) some of the data saves as "NaN" (Not a Number) instead of a very high number, causing ProcEarl to skip these data sets since Matlab prefers numbers over words, and B) the data file saves improperly and does not contain a "/LIDAR" and "/DATA" at the end of the file, which causes Matlab to not be able to read the file since it is not a proper *.xms file. If neither of these problems are happening in the data, then the saturation is not negatively affecting the data and should be ignored.
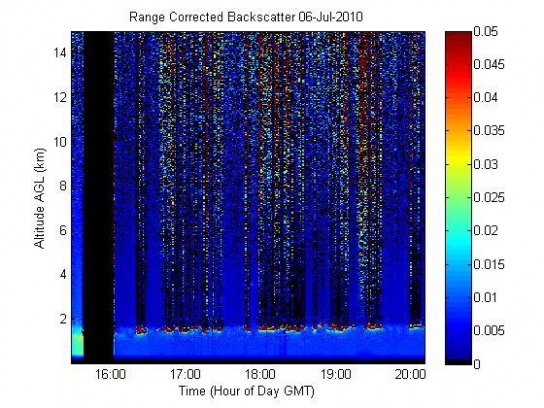
The difference between a cloud mask and a non-cloud mask is astounding. For example, look at the data below. Before the black segment that indicates the laser was turned off, the boundary layer was a bright teal. After we turned the laser back on, it was medium blue, and that is the time that correlates with the cloud mask being on! If the colorscale is zoomed closer, which increases the amount of noise at the top section of the graph, then you can see the boundary layer better--but it is still only half as much backscatter as you should be getting.
Today, there were several clouds that we noted as being very "fluffy". They seem to be consistently at a height of 1.5 kilometers and seem to last for ten minutes or so, pass on, and then more come back for even longer. Why were the clouds all at one level today? More importantly, why aer there no clouds during the beginning segment of data that started at 3:00pm GMT? We noted at that time that there were clouds in the atmosphere, but nothing shows up on the graph. The only thing that shows up is the amazing amount of backscatter from the boundary layer. We usually do not get that much backscatter from the boundary layer, cloud mask or no cloud mask. Simultaneously, there is a cloud that does not show up on the graph that was, assuredly, there. Were we wrong? Did the clouds just not go directly overhead the LIDAR? Or did the high amount of backscatter from the boundary layer block some of the signal from the clouds?
Today, there were several clouds that we noted as being very "fluffy". They seem to be consistently at a height of 1.5 kilometers and seem to last for ten minutes or so, pass on, and then more come back for even longer. Why were the clouds all at one level today? More importantly, why aer there no clouds during the beginning segment of data that started at 3:00pm GMT? We noted at that time that there were clouds in the atmosphere, but nothing shows up on the graph. The only thing that shows up is the amazing amount of backscatter from the boundary layer. We usually do not get that much backscatter from the boundary layer, cloud mask or no cloud mask. Simultaneously, there is a cloud that does not show up on the graph that was, assuredly, there. Were we wrong? Did the clouds just not go directly overhead the LIDAR? Or did the high amount of backscatter from the boundary layer block some of the signal from the clouds?
Nice, fluffy clouds
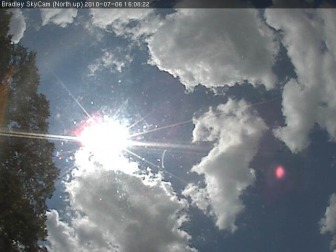
The clouds looked white when we looked up in the sky, but the skycam shows that they are more grey than our sun-blinded eyes led us to believe. These are the sort of clouds that EARL kept detecting. The boundary layer is only detectable at altitudes below the clouds. Either this means that the clouds block the boundary layer from being detected, or the boundary layer only occurs between the ground and the clouds if there is a high amount of clouds. The clouds could act as a wall under which the air mixes.
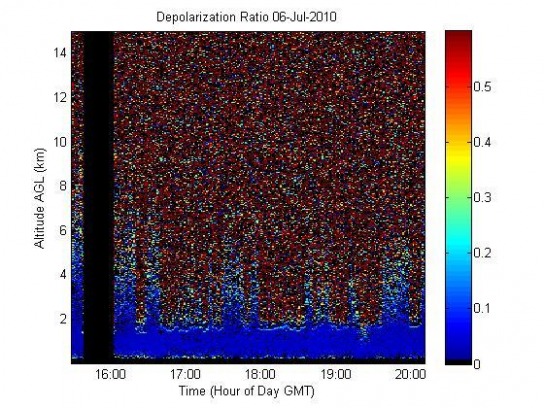
Nothing significant shows up on the Depolarization Ratio graph for today. The areas where the blue seemingly spikes upward correlate with the areas/times that the clouds inhabit in the Range Corrected Backscatter graph. The lower lying blue section does not go above about 1.5 kilometers during the times that the clouds were at the exact height.
