June 21, 2010
Today we did a normal 9.5-hour run. The skies were mostly clear all day, except for clouds during the second half of the run from about 4:30pm GMT until 9:21pm GMT, when the data run ended. At 6:19pm GMT, Haviland made a special note about the low 2000-meter clouds that showed as having a significant amount of depolarization signal. These type of clouds had been continuously showing up since about 4:30pm GMT, and have been observed on other days.
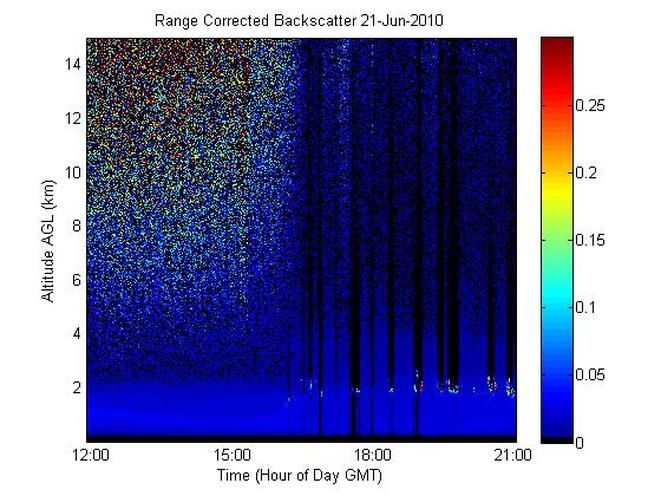
Why would a depolarization signal be coming from low clouds that likely have no ice in them? Haviland thinks the signal comes from thick, darker gray clouds. The Range Corrected Backscatter graph definitely shows that there was something at 2 kilometers from about 4:30pm GMT until 9:21pm GMT, although it is thicker from 6:30pm GMT onwards. The graphs below are shown larger so the clouds at 2 kilometers can be seen.
Why would a depolarization signal be coming from low clouds that likely have no ice in them? Haviland thinks the signal comes from thick, darker gray clouds. The Range Corrected Backscatter graph definitely shows that there was something at 2 kilometers from about 4:30pm GMT until 9:21pm GMT, although it is thicker from 6:30pm GMT onwards. The graphs below are shown larger so the clouds at 2 kilometers can be seen.
When one zooms in on this graph so that only up to 2 kilometers is viewed for the entire span of time, more activity in the boundary layer shows up.
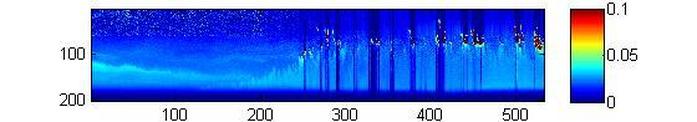
At 12:00pm GMT, the sun had already risen, and the boundary layer had already started heating up. So why, then, is there a horizontal streak that seems to move slightly downward? If indeed the streaks are different levels of the boundary layer or layers of different humidities, then these layers seem to fall as the day heats up further.
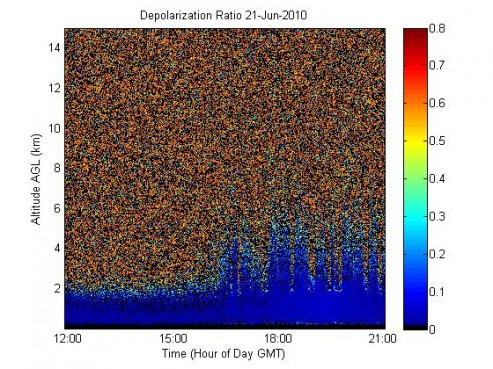
The depolarization signals seen on LabView do not seem as noticeable on the Depolarization Ratio graph. Where the clouds are on the Range Corrected Backscatter graph, the Depolarization Ratio graph only shows that noise exists at that point. The orange noise that covers most of the graph spikes downward exactly where the clouds should be and exactly where the Range Corrected Backscatter graph could not pick up any signal. It seems, then, that what might appear to be a significant Cross-Polar backscatter does not necessarily show up on the Depolarization Ratio graph.
With such a supposedly insignificant Cross-Polar signal, should one still assume that something in these low clouds is depolarizing the laser light?
With such a supposedly insignificant Cross-Polar signal, should one still assume that something in these low clouds is depolarizing the laser light?
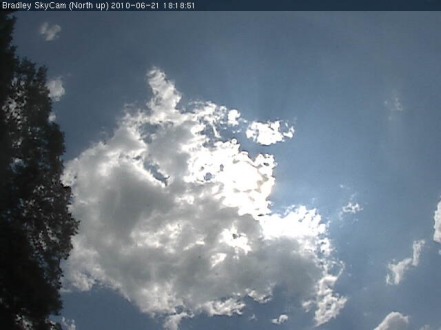
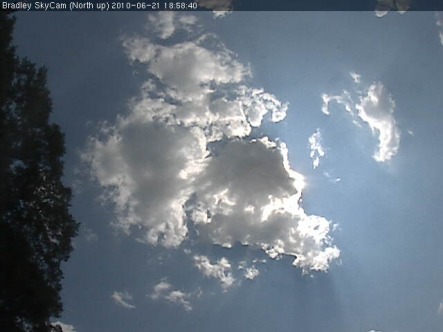
This is a picture from the skycam when low, 2000-meter clouds with significant depolarized backscatter were observed, at 6:20pm GMT. The cloud is relatively thick and medium-gray. This caused the signal on the Range Corrected Backscatter graph that was small but noticeable. The picture below is from about 7:00pm GMT, when the backscatter signal was especially strong in LabView. See how much darker that cloud is, and how thick it seems to be from the sunlight blocked behind it? That caused a signal on the Range Corrected Backscatter graph that ranges about 500-meters thick! The Depolarization Ratio graph seems to have noise above these clouds, but a bit of non-noisy turquoise where and when the clouds below were overhead. Thicker clouds have a stronger, less noisy depolarization signal. An eye should be kept out, in the future, for thickness of clouds at low altitudes versus how strong the depolarization signal is.
Also, as has been noted before but bears repeating again, cloudy atmosphere where clouds come and go every few minutes creates a lot of background noise. This noise is obvious on the Depolarization Ratio graph, but also on the lack of noise on the Range Corrected Backscatter graph, which has complete black sections above the clouds at 2 kilometers. The graph of Background noise that is subtracted from the data shows a relatively clear day until the clouds began to show.
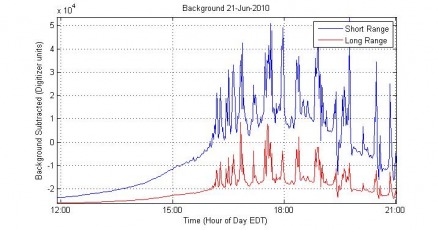
As you can see, at about 4:30pm GMT, the background noise began spiking upwards every few minutes. Since this was during the same times as the regular cloud activity that came and went, it is very likely that each "spike" in the background noise occurred at the same time that a cloud was overhead.
