June 15, 2010
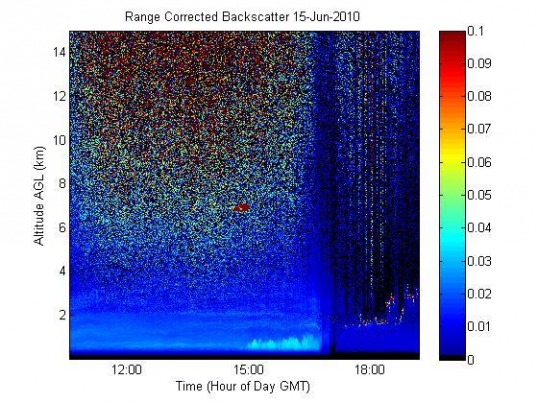
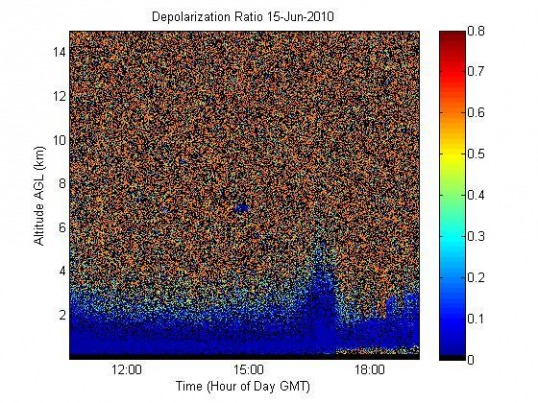
We ran another eight and a half-hour data run today. Haviland arrived earlier than usual and started EARL up at 10:33am GMT, and the run lasted until 7:15pm GMT. It was very clear in the early morning, despite being a muggy day outside. Today was intended to be another clear-skies data run, but as usual something interesting happened. There was something in the sky around 7 kilometers that had a very strong backscatter signal as well as a depolarization signal. Usually, ice does not form into clouds until 7 kilometers or above, so that was likely the signal bouncing off of some low cirrus clouds. Interestingly enough, the depolarization signal also kicked up between 4 and 5pm GMT, although the range-corrected backscatter signal did not show anything significant. The backscatter signal from the graph of the subtracted background noise matches up with the suggested rise in depolarization signals around 16:00-17:00 GMT. Possibly, this was just the effect of aerosols heating up in the atmosphere and rising, which would make sense since the afternoon seems like the hottest time of the day and since aerosols rise along with and are stirred up by heat. The aerosol optical thickness today was about 1.9 for 500nm.
This depol signal shows up on the subtracted background plot.
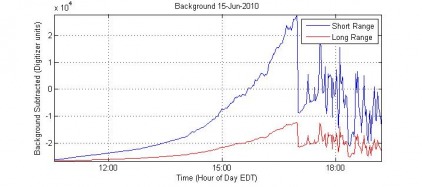
This graph of the backscatter with the background noise subtracted correlates with the Depolarization Ratio graph and shows that something was occurring around 16:00-17:00 GMT. The weird up-and-down after 18:00 on the Background Subtracted graph (to the left) indicates strong cloud activity. This can be seen in real-time on the RunEarl program screen, as well.
This shows up on real-time during RunEarl, too.
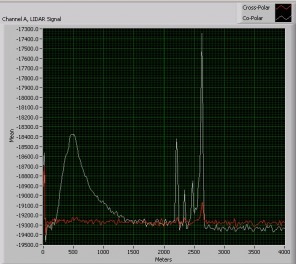
This up-and-down signal is due to the amount of clouds in the sky at different levels that could be seen and observed from the EARL hatch. Usually, having three or four of these spikes/clouds so near to each other results in rain. The past three times that Haviland was watching out for rain on the weather.com radar map, the rain showed up quicker on the RunEarl screen via three or four cloud spikes that are close together, rather than on the weather.com radar map. Possibly, that rise in the depolarization ratio and on the subtracted background backscatter signal suggests that there was a high amount of aerosol and rising activity in the boundary layer right before the rain and the immense amount of clouds.
