June 18, 2010
We tried to do a 14-hour run today to watch the boundary layer from sunrise to sunset, but we got started a bit late. The day was very clear with only a few clouds later in the day, which we had to put a cloud cover on for. There was a slight rain at some point around 8:00pm GMT. The EARL framework temperature began at 68 degrees at 10:53am GMT but reached 82 degrees by 5:40pm GMT. We missed a few minutes of data, although neither of us recognized that the data had stopped saving, nor do we remember turning it off. Thankfully, not much was lost. Lauren ran EARL from 10:53am GMT until 6:00pm GMT, and Haviland was here from 4:00pm GMT until around sunset at 12:06am GMT.
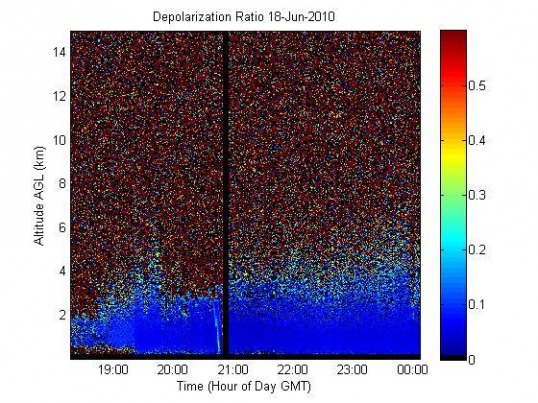
If you look at the graphs, something interesting seems to have been happening at 11 km around 10:30pm GMT, but there was no depolarization signal to correspond and suggest ice clouds, no matter how much I changed the colorbar scale.
Although we were trying to watch the boundary layer heating up and cooling down from sunrise to sunset, the clouds from 8:00pm GMT until 9:00pm GMT as well as the clouds at the beginning of the data run obscure a direct view of the boundary layer happenings. The boundary layer, from this graph, seems to cool down at about 7:30pm GMT. However, the presence of clouds makes it look as thought the boundary layer rises again at 8:00pm GMT. We need to plan a data run during a clearer day to observe the boundary layer more efficiently.
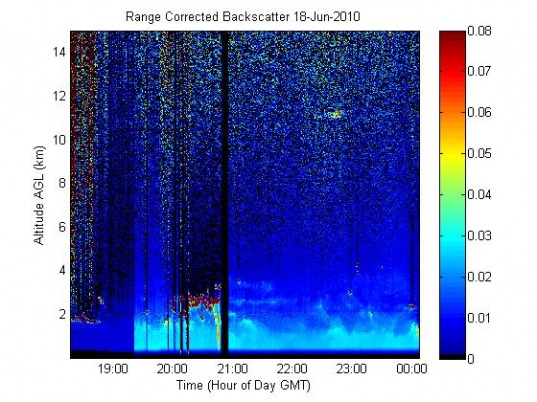
However, both the Range Corrected Backscatter graph and the Depolarization Ratio graph both show a strong line of backscatter directly before we forgot to save data. What is that line? It shows up as a greenish-yellow intensity on the Range Corrected Backscatter graph and as a light blue line on the Depolarization Ratio graph. The line begins at about 2 kilometers and then reaches all the way down to the LIDAR itself. Perhaps it is a computer glitch? If so, it is a very interesting-looking one.