June 30, 2010
Today's run did not get started until around 3:00pm GMT because Jilly Bo/the computer showed the Blue Screen of Death at the end of yesterday's 31-hour run. Duke the ITS guy came in, took the hard drive out of the computer, copied all the files onto a new hard drive, and set up the new hard drive in the computer. He also took one of the four memory chips out of the computer because the fan was running harder than it should and because the fan stopped running so hard once he pulled it out, so he though there might be something wrong with that chip as well.
We kept getting interesting data, right from the beginning. There was a thick gray cloud over EARL initially, and we had to scale down to 8 data sets per save to get rid of most of the noise. When we changed it to 42 data sets per save, which is where it is usually set, the long range channel no longer agreed with the short range channel. The short range channel mainly had a spike at 500 meters, and the long range channel did not spike until about 1500 meters. The dark gray cloud was so low in the sky and backscattered so much light that the boundary layer was no longer visible in comparison to the cloud that was at 500 meters. Meanwhile, something kept popping up around 6 kilometers, 8 kilometers, and 10 kilometers... during the day! Haviland was very excited to see how the data would turn out once it had been processed with ProcEarl. The wind was moving at 0 knots, so whatever was up there stayed up there for a significant amount of time.
We kept getting interesting data, right from the beginning. There was a thick gray cloud over EARL initially, and we had to scale down to 8 data sets per save to get rid of most of the noise. When we changed it to 42 data sets per save, which is where it is usually set, the long range channel no longer agreed with the short range channel. The short range channel mainly had a spike at 500 meters, and the long range channel did not spike until about 1500 meters. The dark gray cloud was so low in the sky and backscattered so much light that the boundary layer was no longer visible in comparison to the cloud that was at 500 meters. Meanwhile, something kept popping up around 6 kilometers, 8 kilometers, and 10 kilometers... during the day! Haviland was very excited to see how the data would turn out once it had been processed with ProcEarl. The wind was moving at 0 knots, so whatever was up there stayed up there for a significant amount of time.

In addition to the thick clouds, the skycam seemed very dirty. At first, Haviland thought thick, sooty particles were floating around in the lower atmosphere; but the particles were just dirt on the skycam.
Today's data turned out to be a fascinating study. First of all, there were an incessant amount of time skips due to ProcEarl. I looked at the data corresponding to one of the time skips, but there was nothing wrong with it. No "NaN" indicating saturation, no problems with the opening or closing headers of the file. The data looked perfectly normal. For some reason, though, ProcEarl skipped what seems to be every other minute of data. When I investigated this further, it turned out that the folder that saved the data only had every other few minutes of data. I know that we ran LabView with 42 data sets per save, and yet it did not save as it normally does every minute.
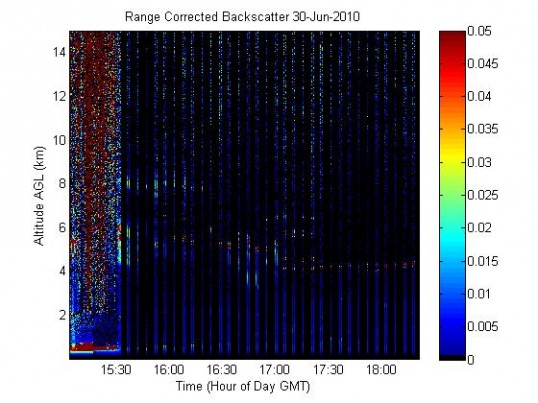
If we had gotten all the data, it would have turned into a magnificent graph. Even without all the data, we can see snapshots of what there was. Look, for example, at the beginning of the data run. There was a very thick cloud at about 300-500 meters that persisted for about thirty minutes. Then, at 3:30pm GMT, something was located at 8 kilometers, and something else was located at 6 kilometers. Whatever was at 6 kilometers was about 2 kilometers thick! The 8-kilometer object persisted for waht seems to be a longer amount of time, though, from 3:30pm GMT until 4:30pm GMT. Meanwhile, the 6-kilometer object only lasted for about thirty minutes, and then a thinner 6-kilometer object persisted from 4:00pm GMT until 5:00pm GMT.
At 5:00pm GMT, it looks like two or three separate cloud layers were in the sky. The 4-kilometer object lasted until 6:30pm GMT. The other one or two objects, both located at about 6 kilometers, only lasted for about 30 minutes before disappearing. Then the returns were mostly nil.
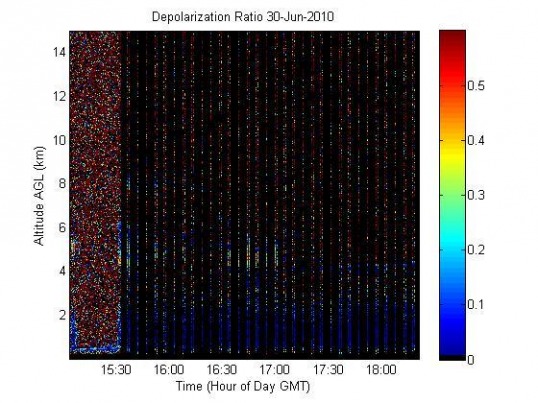
Meanwhile, look at the Depolarization Ratio graph! The objects initially at 6 and 8 kilometers show up on this graph as well, which indicates some significant amount of either ice particles or aerosols. Ice usually does not form in high-altitude clouds until 7 kilometers, but the object that is two kilometers thick and rested between 4 and 6 kilometers has an obvious depolarization signal. The particulate matter count for this day was low, so aerosols are not likely the cause. Plane contrails would not be that thick, nor would they be located at that height. Therefore, the clouds between 4 and 6 kilometers must have contained a significant amount of ice. Amazing!
The object at 8 kilometers does not have a very strong depolarization signal in comparison. However, the object that comes back at 6 kilometers at 4:30pm GMT also has a significant depolarization signal that would suggest ice particles.
If only more of the data had saved...
The object at 8 kilometers does not have a very strong depolarization signal in comparison. However, the object that comes back at 6 kilometers at 4:30pm GMT also has a significant depolarization signal that would suggest ice particles.
If only more of the data had saved...
