June 14, 2010
We started a bit later today at 2:09pm GMT. The sky was a bit hazy, but otherwise pretty clear. There were thin, spread out clouds in the sky. Jilly Bo booted up very slowly. We later ascertained that this was due to the back-up drive being plugged in. If the back-up drive is not connected to the computer, then Jilly Bo will start up quickly; but if they are connected, she starts up very slowly. Today was the first day we used MICROTOPS to measure aerosol optical thickness, as well as other parameters. The first measure of aerosol optical thickness was .338 at 500nm. Relative humidity was around 60-65% during most of the data run.
There were a few sparse clouds noticeable in the data varying in altitude between 1 and 2 kilometers. They show up as dark red blobs on the Range Corrected Backscatter graph. The sections directly under the clouds seems to be brighter turquoise-green than nearer to the ground. Considering light backscatters well off of water particles, this could be due to a spike in humidity underneath clouds that predominantly carry water. We should keep an eye out for similar effects in the future.
There were a few sparse clouds noticeable in the data varying in altitude between 1 and 2 kilometers. They show up as dark red blobs on the Range Corrected Backscatter graph. The sections directly under the clouds seems to be brighter turquoise-green than nearer to the ground. Considering light backscatters well off of water particles, this could be due to a spike in humidity underneath clouds that predominantly carry water. We should keep an eye out for similar effects in the future.
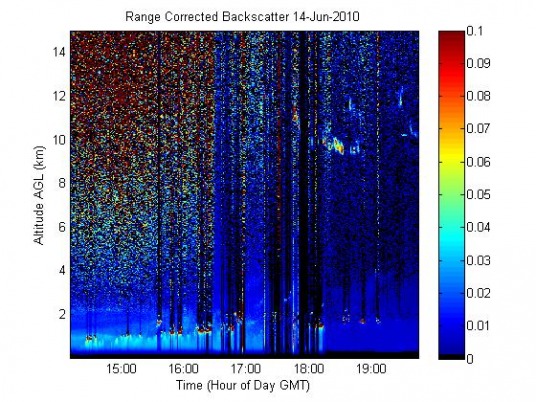
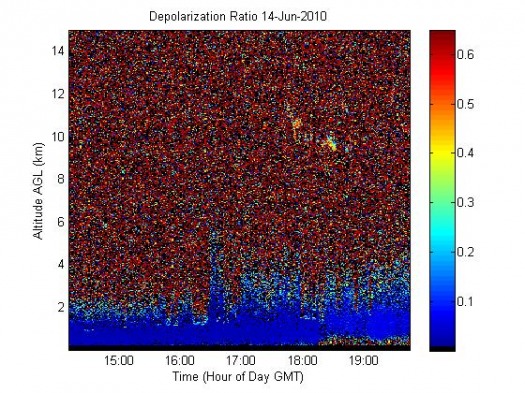
There is something significant at 10 kilometers, as well. Since it is so high up and since it also has a depolarization signal as evidenced by the Depolarization Ratio graph below, the object is probably a cirrus cloud. However, while the main structure at around 10 kilometers is a cirrus cloud, the object at 12 kilometers and at 10 kilometers near the end of the data run might be something else. Neither of these objects has a depolarization signal, although that might be due to their thinness and short span of time rather than due to their alternate nature.
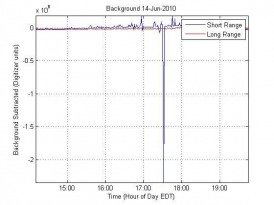
Something was wrong with the data set, although it was not too noticeable on the Range-Corrected Backscatter and Depolarization Ratio graphs. The Background Subtracted graph should not go below zero, but it did. I checked the data for this time, and it was filled with NaN, which Matlab does not read in. This probably caused the Background Subtracted graph to result in a negative number during the minutes corresponding to those data sets. However, there were still some useful and interesting clouds up at 10 km from about 6pm GMT until 7pm GMT. Since they are that high up and have a depolarization signal, they were most likely cirrus clouds, although they could also be plane contrails. However, due to the amount of time they were there, cirrus clouds are more likely.
