June 24, 2010
This morning was a night run from 12:50am GMT until 8:59am GMT, with a focus mainly on the heating up of the boundary layer from midnight until sunrise. As recorded yesterday, streams of wind and/or varying aerosol levels occur between the ground and 2 kilometers, especially around 6:00am GMT. At the beginning of the run at 12:20am GMT, there was a low-lying cloud at 4 kilometers, as visible on the graph. Haviland noted this is the data at 12:51am GMT, when she noticed that it was still there. There was also a small, hardly noticeable blip that could have been a cloud around 5:30am GMT that only lasted a couple of minutes and was located at about 2 kilometers. This might also just be a second of noise amongst the turquoise streams; however, the dark blackish light above it usually indicates a thick cloud. Notice the dark section above the 4 kilometer cloud. Usually, the dark streams are an indicator of something blocking out most of the ligh above, which means less noise and less blue background.
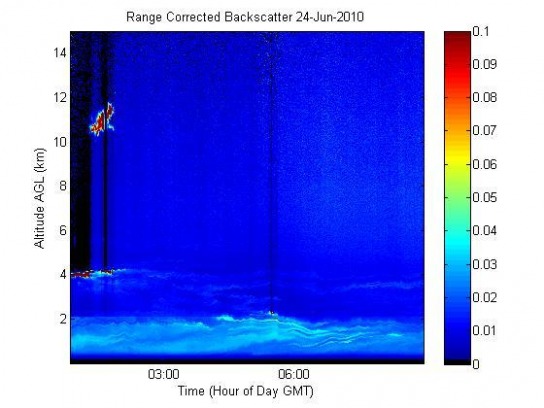
What on earth are those streams of turquoise? They occurred yesterday, but have not appeared in any of the data in these past few weeks. What is different about this week? A storm is brewing in the Tropics, but the wind usually moves from the Northwest to here, so the effect of that is questionable. It has not been exceptionally windy. Smoke is on its way, but it is not here yet, and it would have a depolarization signal anyway. The Range Corrected Backscatter graph from June 16 has a slightly-noticeable stream effect, but not as complicated or as noticeable as yesterday's or today's.
The cloud at 4 kilometers
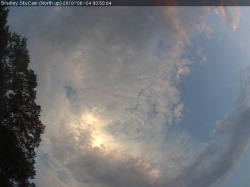
To the left is a picture taken with the skycam at the same time as the cloud was hovering at 4 kilometers. The thickness of the lower-lying clouds obscures the camera's vision of the occurence from 10 to 12 kilometers that lasted for about an hour. However, the depolarization signal in the graph below indicates that it was probably a cirrus cloud, due to the thickness of the cloud and the amount of depol signal. This depolarized signal was caused by the ice particles in cirrus clouds at this altitude. Also, observe the depolarization signal at 4 kilometers at the beginning of the data run. Although it seems a bit noisy, it's near-solid color amidst dark noise signals suggests that some noticeable amount of aerosols and/or ice were present in the clouds at 4 kilometers. The depolarization signal occured during the time that the cloud was at its thickest. Scroll between the Range Corrected Backscatter plot and the Depolarization Ratio graph, and look at the area right at 4 kilometers at the very beginning. When the cloud is at its thickest on the Range Corrected Backscatter graph, the Depolarization Ratio graph shows a corresponding non-noisy depolarization signal. An eye should be kept out for whether this depolarization signal only occurs during the thickest (and probably darkest gray) part of the cloud, and if so, what that entails.
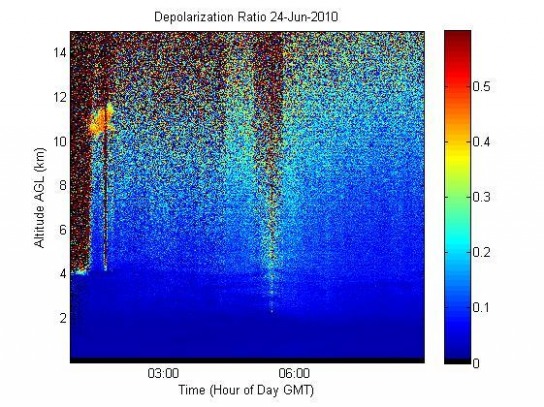
Look the the cirrus cloud that lasted from about 1:00am GMT until 2:00am GMT! It has a very strong depolarization signal and is likely composed of ice particles. The spike-downward of noise that occurs right before 6:00am GMT (it looks like a rusty icecycle on the graph) corresponds with the possible-cloud on the Range Corrected Backscatter graph. This type of behavior on the Depolarization Ratio graph usually indicates that there was a cloud at that point. Why does it indicate this? No idea, but on several graphs from several different data sets, the correlation is usually there. For example, look at the clouds at 4 kilometers that show up on the Depolarization Ratio graph. There is a large amount of noise at altitudes higher than the cloud, but none below it. Also, this is observable with the cirrus cloud at 10 to 12 kilometers. There is noise above it, and no noise below it.
It should be noted that the area below 4 kilometers, which shows a significant amount of activity in the Range Corrected Backscatter graph, has no correlated activity on the Depolarization Ratio graph. In fact, no significant depolarization signal at all is observable on the Depolarization Ratio graph. This suggests that the activity in that section on the Range Corrected Backscatter graph does not have anything to do with aerosols. If it is a wind-dependent and wind-affected activity, then supposedly wind would carry aerosols in it. Dust, pollen, ash, carbon- based molecules that are spiky and emit from cars--none of these seems to show up (or, at least, they do not seem to fluctuate) along with the streams in the Range Corrected Backscatter graph. So what, then, were those streams?
It should be noted that the area below 4 kilometers, which shows a significant amount of activity in the Range Corrected Backscatter graph, has no correlated activity on the Depolarization Ratio graph. In fact, no significant depolarization signal at all is observable on the Depolarization Ratio graph. This suggests that the activity in that section on the Range Corrected Backscatter graph does not have anything to do with aerosols. If it is a wind-dependent and wind-affected activity, then supposedly wind would carry aerosols in it. Dust, pollen, ash, carbon- based molecules that are spiky and emit from cars--none of these seems to show up (or, at least, they do not seem to fluctuate) along with the streams in the Range Corrected Backscatter graph. So what, then, were those streams?
