June 28, 2010
Today's data run started off with pretty clear skies and high, thin, wispy clouds. METAR data says that the wind was moving at a speed of 6 knots. This run would end up lasting 31 hours. It began at 12:00pm GMT and lasted until 8:21pm GMT, when the computer crashed with the normal Blue Screen of Death that follows the Memory Parity Error.
There were several clouds at the beginning of the run at 12:20pm GMT on the 28th, more clouds at 4:30am GMT on the 29th, more clouds at 6:30am GMT, and even more at 5:20pm GMT. We had to place a cloud mask on at these times. Look at the times where the cloud mask was placed, though. From 12:24pm GMT on the 28th until 8:50pm GMT, the cloud mask was on. This correlates with the time on the Range Corrected Backscatter graph that no turquoise shows up below 3 kilometers. That section has less light coming through, so less shows up on the graph. What does show up should have a very, very strong signal. Look at the beginning of the graph from 12:00pm GMT until 12:20pm GMT when the cloud mask was placed on the primary mirror. The section of the atmosphere below 2 kilometers is bright, bright turquoise, and there is a very red/strong signal coming from a cloud just below the 2-kilometer mark. This cloud signal, as well as the atmospheric signal below it in the boundary layer, decreases by at least .2 once the cloud cover was placed on it. At about 6:00pm GMT on the 29th (the second 18:00 on the graph), a cloud clover was placed on the primary mirror again. The darkening effect, where the turquoise area is suddenly dark blue, happens again here. Hopefully, the GTRI folks can find a way to fix the ProcEarl script so that it asks the user for what times the cloud mask was put on and how much light percentage-wise should be blocked by the cloud mask.
There were several clouds at the beginning of the run at 12:20pm GMT on the 28th, more clouds at 4:30am GMT on the 29th, more clouds at 6:30am GMT, and even more at 5:20pm GMT. We had to place a cloud mask on at these times. Look at the times where the cloud mask was placed, though. From 12:24pm GMT on the 28th until 8:50pm GMT, the cloud mask was on. This correlates with the time on the Range Corrected Backscatter graph that no turquoise shows up below 3 kilometers. That section has less light coming through, so less shows up on the graph. What does show up should have a very, very strong signal. Look at the beginning of the graph from 12:00pm GMT until 12:20pm GMT when the cloud mask was placed on the primary mirror. The section of the atmosphere below 2 kilometers is bright, bright turquoise, and there is a very red/strong signal coming from a cloud just below the 2-kilometer mark. This cloud signal, as well as the atmospheric signal below it in the boundary layer, decreases by at least .2 once the cloud cover was placed on it. At about 6:00pm GMT on the 29th (the second 18:00 on the graph), a cloud clover was placed on the primary mirror again. The darkening effect, where the turquoise area is suddenly dark blue, happens again here. Hopefully, the GTRI folks can find a way to fix the ProcEarl script so that it asks the user for what times the cloud mask was put on and how much light percentage-wise should be blocked by the cloud mask.
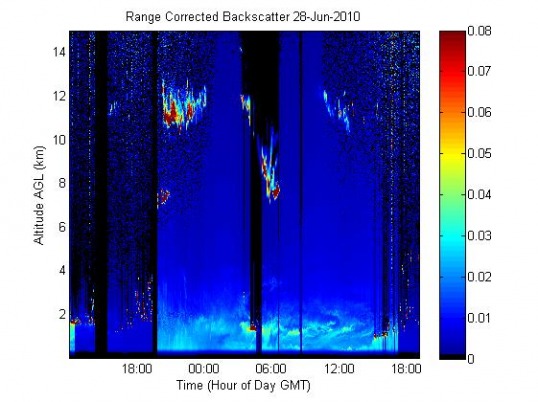
No we should bring up the question: what on earth is happening up in the sky? There are clouds apparent at the beginning of the run from 12:00pm GMT until 2:12pm GMT. There also seem to be clouds that began around 6:00pm GMT and lasted until 7:20pm GMT. More low-lying clouds occur right around 4:15am or so and get heavy enough that by 4:34am GMT, the heaviest cloud mask still shows as having long range saturation. The last bit of low-lying, around-2-kilometer clouds occurs at around 3:00pm GMT and gets so heavy by 5:13pm GMT that a cloud mask has to be placed over the primary mirror.
Also, look at the signals coming from 10-12 kilometers. Those signals lasted about three and a half hours! The wind speed around the time was between 10 and 11 knots, so for the object to last that long must mean that it took up a significant horizontal proportion of the atmosphere. Since it is at 12 kilometers, has a depolarization signal as shown by the Depolarization Ratio graph below, and lasted for a very long amount of time, the object was probably a cirrus cloud. But that cloud lasted for three and a half hours, minimum!
Also, look at the signals coming from 10-12 kilometers. Those signals lasted about three and a half hours! The wind speed around the time was between 10 and 11 knots, so for the object to last that long must mean that it took up a significant horizontal proportion of the atmosphere. Since it is at 12 kilometers, has a depolarization signal as shown by the Depolarization Ratio graph below, and lasted for a very long amount of time, the object was probably a cirrus cloud. But that cloud lasted for three and a half hours, minimum!
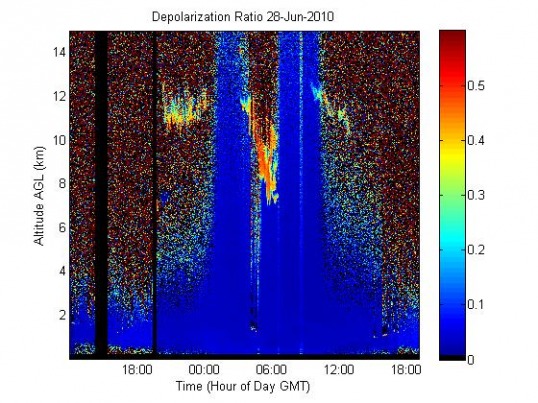
The biggest surprise of the day comes from around 4:00am GMT on the 29th until about 7:00am GMT. There is an object about 4 kilometers thick that lasts for about two to three hours. It stars off at about the same height and thickness as the cirrus cloud at 9:00pm GMT on the 28th, but then it gradually gets thicker and thicker as time passes, reaching up to 4 kilometers thick at one point. It has a very strong depolarization signal throughout, which means higher ice and/or aerosol concentrations. However, when you look at the Range Corrected Backscatter graph, there is a much smaller signal that is only 2 kilometers thick at 6:00am GMT on the 29th. The normal backscattered light only shows up as hitting the bottom part of the cloud, but the depolarized signal shows up from farther up. How does this make sense? Is it truly an extra thick cirrus cloud, or is it a cirrus cloud with something else above and/or below it?
Of less importance is the other probable cirrus cloud of the run, which occurred around 12:00pm GMT. However, since cirrus clouds usually only show up during night runs (like the one in the very late hours of the night before), it is interesting that a cirrus cloud is showing up after the sun has already risen and for a significant amount of time. There seems to be a higher section of the cirrus cloud and a lower section, each lasting about 40 minutes to an hour each.
What cool data!
And, even more, whatever occurred or showed up as scattered light from 4:35am GMT on the 29th until about 4:51am GMT should have a signal at least 8 times as strong. A cloud went over at that point in time that backscattered so much light that the cloud cover that covers the most light (it is a big circular cover with only a 4-inch diameter circle cut out of it to let in light) had to have half of the hole that lets light through covered because the saturation was just too much. That has never happened before. The low-lying cloud at about 2 kilometers during that time should be about 8 times as bright, probably almost in the orange-red zone.
